Deer Population Survey Services
Data-driven deer population analysis using thermal imaging drones and systematic flight patterns. Make informed herd management decisions based on accurate population estimates, not guesswork.
How Drone-Based Deer Surveys Work
Our deer population surveys use thermal imaging drones and systematic flight patterns to provide accurate, repeatable population estimates. Unlike trail cameras or visual counts, thermal surveys capture activity across your entire property in a single session.
This service is designed for landowners, farmers, and property managers who need reliable data to support:
- Crop damage mitigation: Understand deer pressure on agricultural land
- Herd management decisions: Identify population density and movement patterns
- Hunting lease planning: Provide data to support lease agreements or management plans
- Wildlife impact assessment: Document deer activity for insurance or regulatory purposes
Our surveys identify movement corridors, bedding areas, and feeding zones with minimal disturbance to the herd. This is professional methodology, not recreational drone use.
Why Thermal Surveys Beat Traditional Methods
Complete Coverage
Trail cameras only capture activity in specific locations. Thermal surveys cover your entire property, revealing patterns you wouldn't otherwise see.
Fast Turnaround
Get results in days, not weeks. One survey session provides comprehensive data without waiting for cameras to accumulate images over time.
Repeatable Data
Systematic flight patterns ensure consistent methodology. Compare surveys over time to track population changes and management effectiveness.
Minimal Disturbance
Drones operate quietly at altitude, capturing data without altering deer behavior or disrupting natural movement patterns.
Decisions Based on Data Save Money Long-Term
One survey often reveals patterns landowners didn't expect. Whether you're managing crop damage, planning habitat improvements, or evaluating hunting pressure, accurate population data reduces guesswork and supports better decisions.
Deer Survey Pricing Calculator
Get instant pricing for your deer population survey. Larger properties benefit from volume efficiency and lower per-acre rates.
Minimum survey size: 50 acres
Pricing Tiers
All surveys include a $495 base fee plus per-acre charges based on property size
What's Included in Your Survey
Thermal Imagery Captures
High-resolution thermal images showing deer locations and movement patterns across your property.
Population Density Estimates
Calculated estimates of deer per acre based on systematic survey methodology.
Mapped Activity Areas
Visual maps showing bedding areas, movement corridors, and high-activity zones.
Summary Insights Report
Professional summary suitable for planning, lease agreements, or management decisions.
Example Deer Survey Report
See exactly what you receive from a deer survey. This is a sample report from a real-style survey with data anonymized for demonstration purposes.
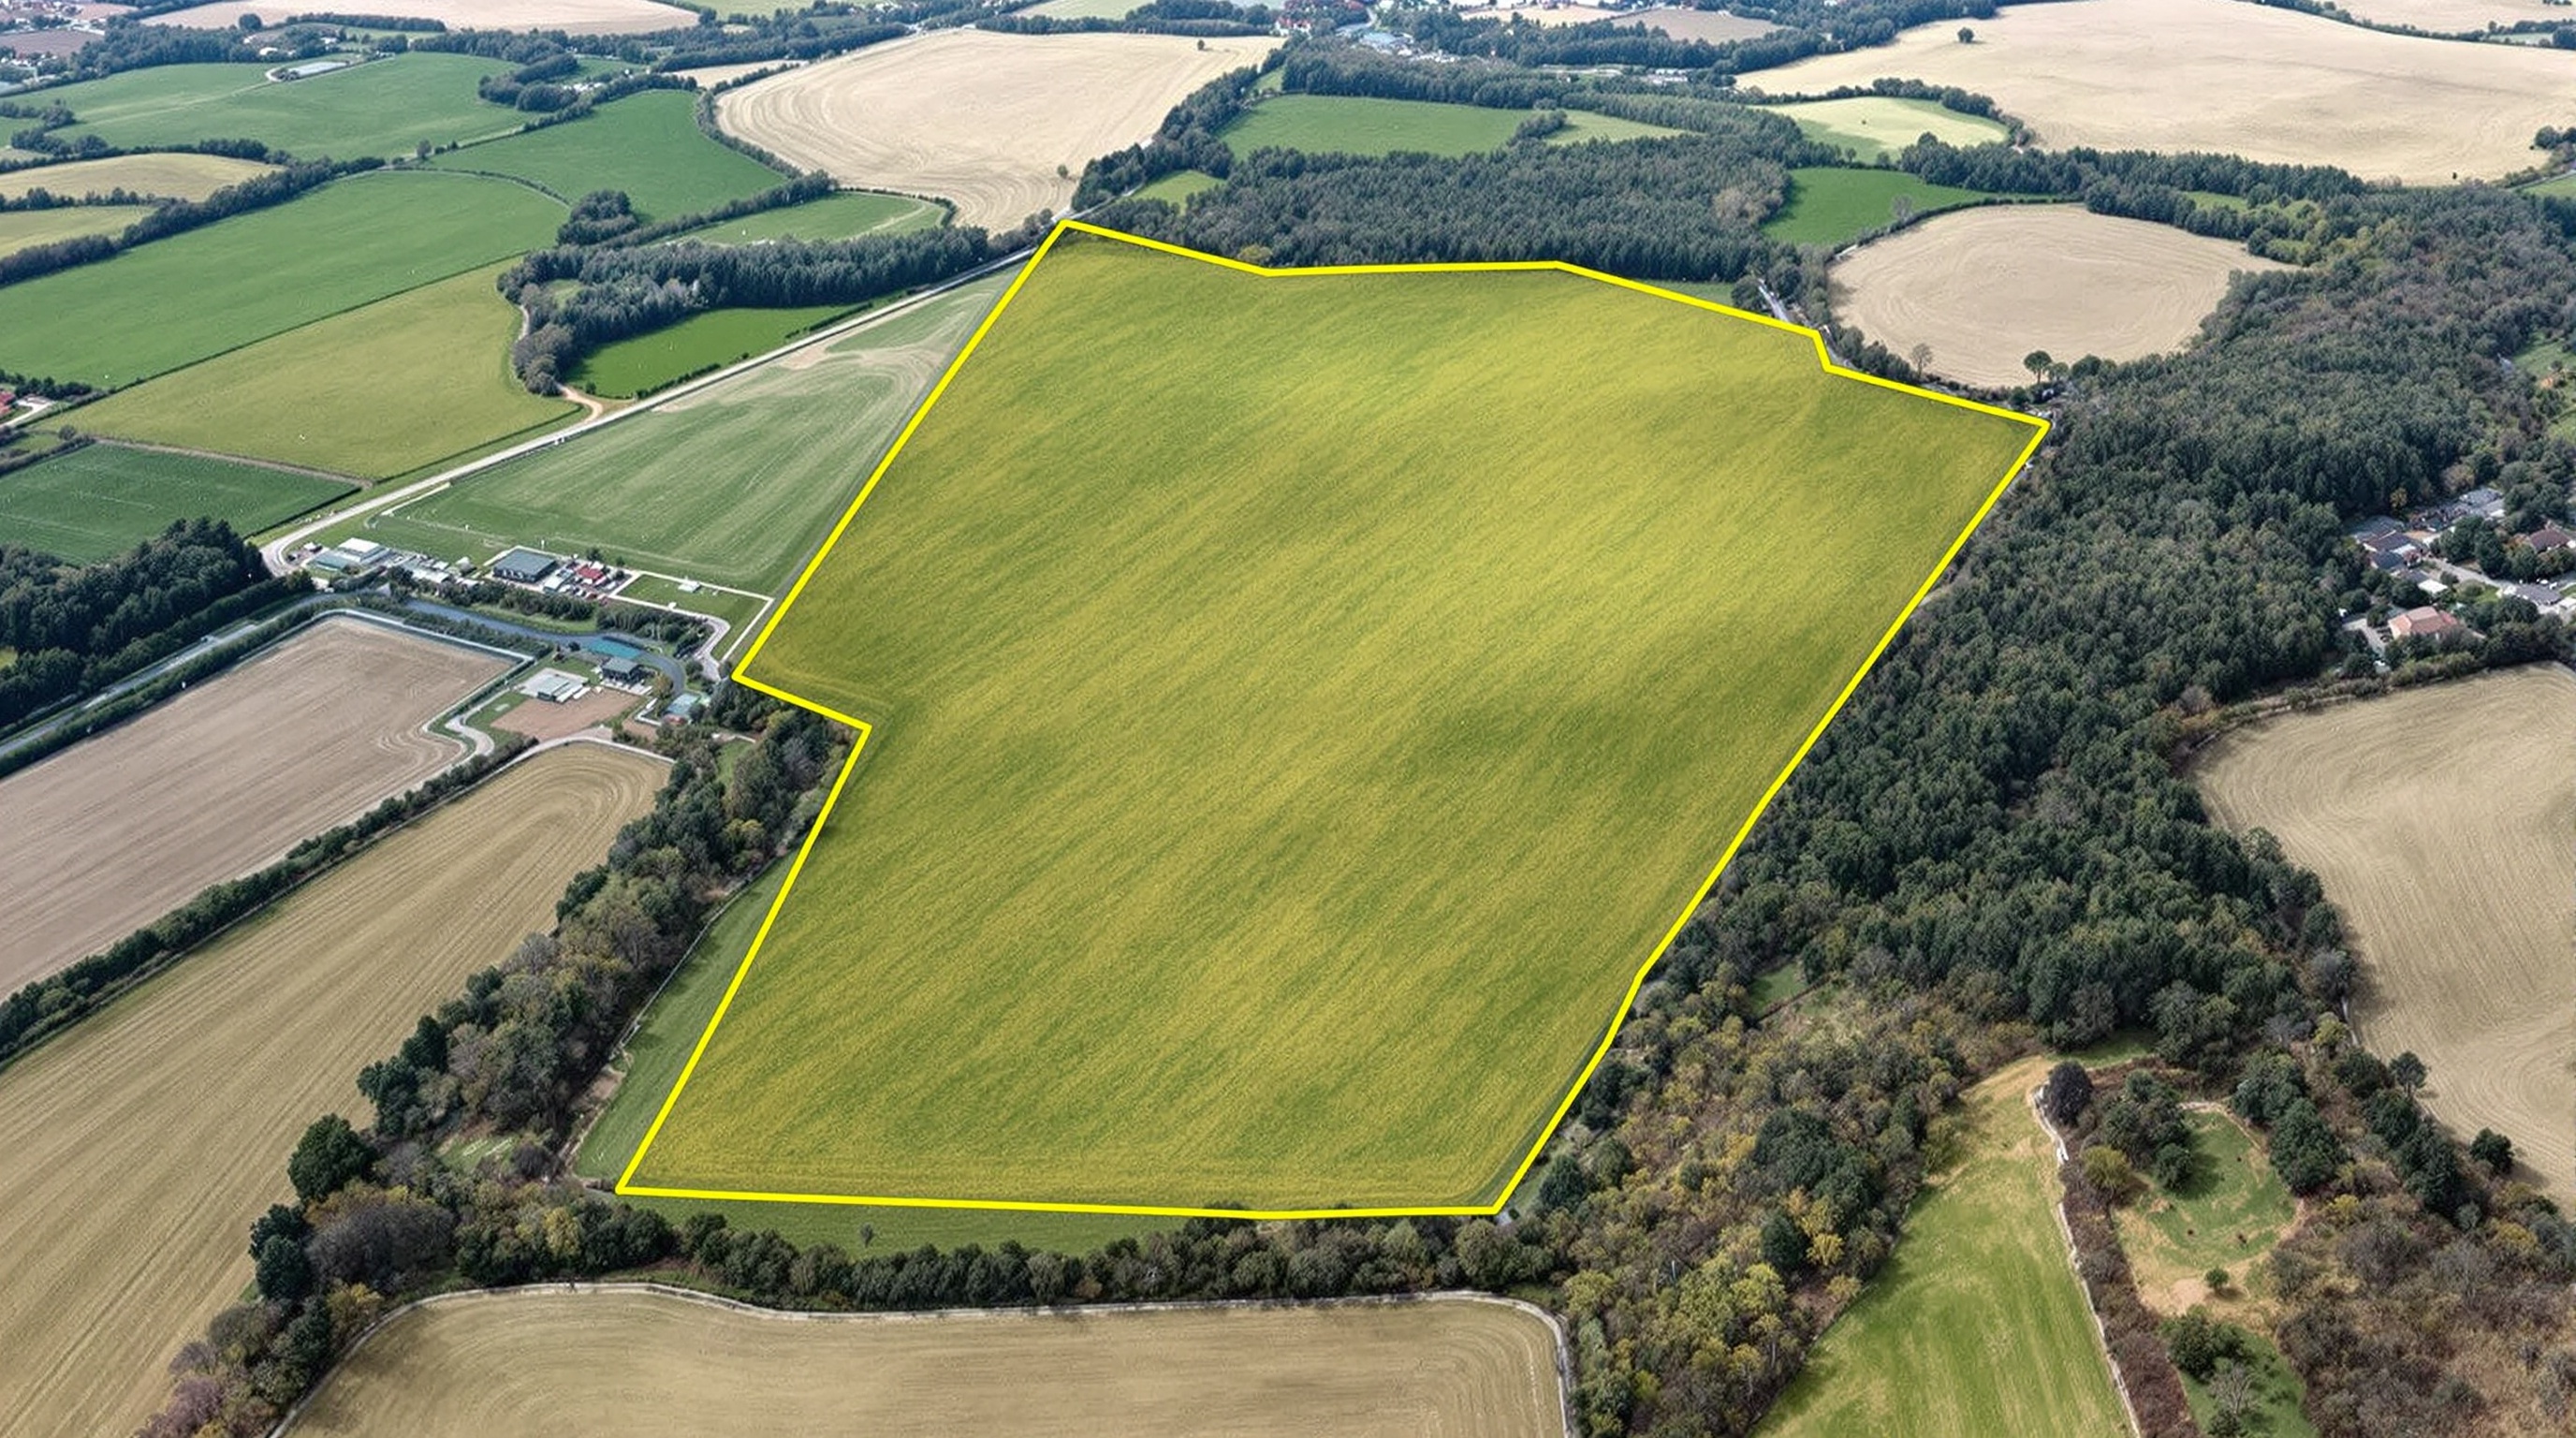
Property Overview
Wildlife Counts Summary
Note: Counts are estimates based on thermal detection and movement analysis during the survey window. Actual population may vary based on deer movement patterns and survey timing.
Visual Detection Examples
Detection Example: Buck in Bedding Area
Thermal imaging reveals heat signatures invisible to the naked eye, allowing precise location identification even in dense cover.
The thermal image highlights the buck's heat signature in bright white and orange tones, making detection immediate and certain. The corresponding standard image shows the animal's exact position and surrounding context. Both images captured from approximately 300 feet AGL to minimize disturbance.
Detection Example: Doe Group in Field Edge
Multiple deer detected simultaneously, showing group behavior and movement patterns near agricultural areas.
Thermal detection allows simultaneous identification of multiple animals, revealing group dynamics and preferred feeding areas. Surveys conducted at altitude ensure minimal disturbance to natural behavior patterns.
Activity & Distribution Map
Map Legend
Each marker represents a detected animal location during the survey. Clustering patterns reveal preferred bedding areas, movement corridors, and high-activity zones across the property.
Insights & Observations
Concentrated Bedding Areas
Primary bedding activity concentrated in northwest wooded section, with secondary bedding along eastern tree line. Does and fawns prefer denser cover.
Movement Corridors Identified
Clear movement corridor between bedding areas and southern agricultural fields. Deer consistently use fence line and tree cover for travel.
Predator Presence Near Field Edges
Three coyotes detected along western and southern field edges. Predator activity may influence deer movement patterns and fawn survival rates.
Higher Activity Density in Southern Section
Southern 40% of property shows significantly higher deer activity, likely due to proximity to food sources and favorable cover conditions.
Methodology Summary
Survey Approach
- Thermal imaging drone with calibrated sensors
- Systematic grid flight pattern for complete coverage
- Flight altitude maintained at 300 feet AGL
- Survey conducted during peak activity hours (dawn)
Analysis Process
- Experienced operators review all thermal captures
- Heat signatures validated against standard imagery
- Location data mapped with GPS coordinates
- Professional summary compiled for client use
Example Deer Survey Report
View a complete sample report showing the level of detail and analysis you'll receive. This example demonstrates our comprehensive approach to deer population assessment, including thermal imagery, distribution maps, and management recommendations.
View Example ReportAbout This Example Report
Demonstration Purpose: This example report is provided for demonstration purposes to show the format, content, and level of detail included in our deer survey deliverables. Property details and data have been anonymized.
Actual Results Vary: Real survey results depend on property conditions, timing, weather, deer behavior, and other factors. Each survey is unique and customized to the specific property surveyed.
Estimates, Not Exact Counts: Deer surveys provide population estimates based on thermal detection and systematic methodology. They are not exact counts and should be used as data points to support management decisions.
Important Information
Survey Accuracy: Deer surveys provide population estimates, not exact counts. Results depend on weather conditions, timing, deer behavior, and survey methodology.
Scope Confirmation: Final survey scope, timing, and flight plan will be confirmed before deployment to ensure optimal conditions and results.
Conditions: Surveys are most effective during dawn or dusk hours when deer are active. Weather conditions must be suitable for safe drone operations.
Professional Service: All surveys are conducted by trained operators using calibrated thermal imaging equipment and systematic flight patterns.
Ready to Survey Your Property?
Get accurate deer population data to support better management decisions. Schedule your survey today.